


 201 / 239

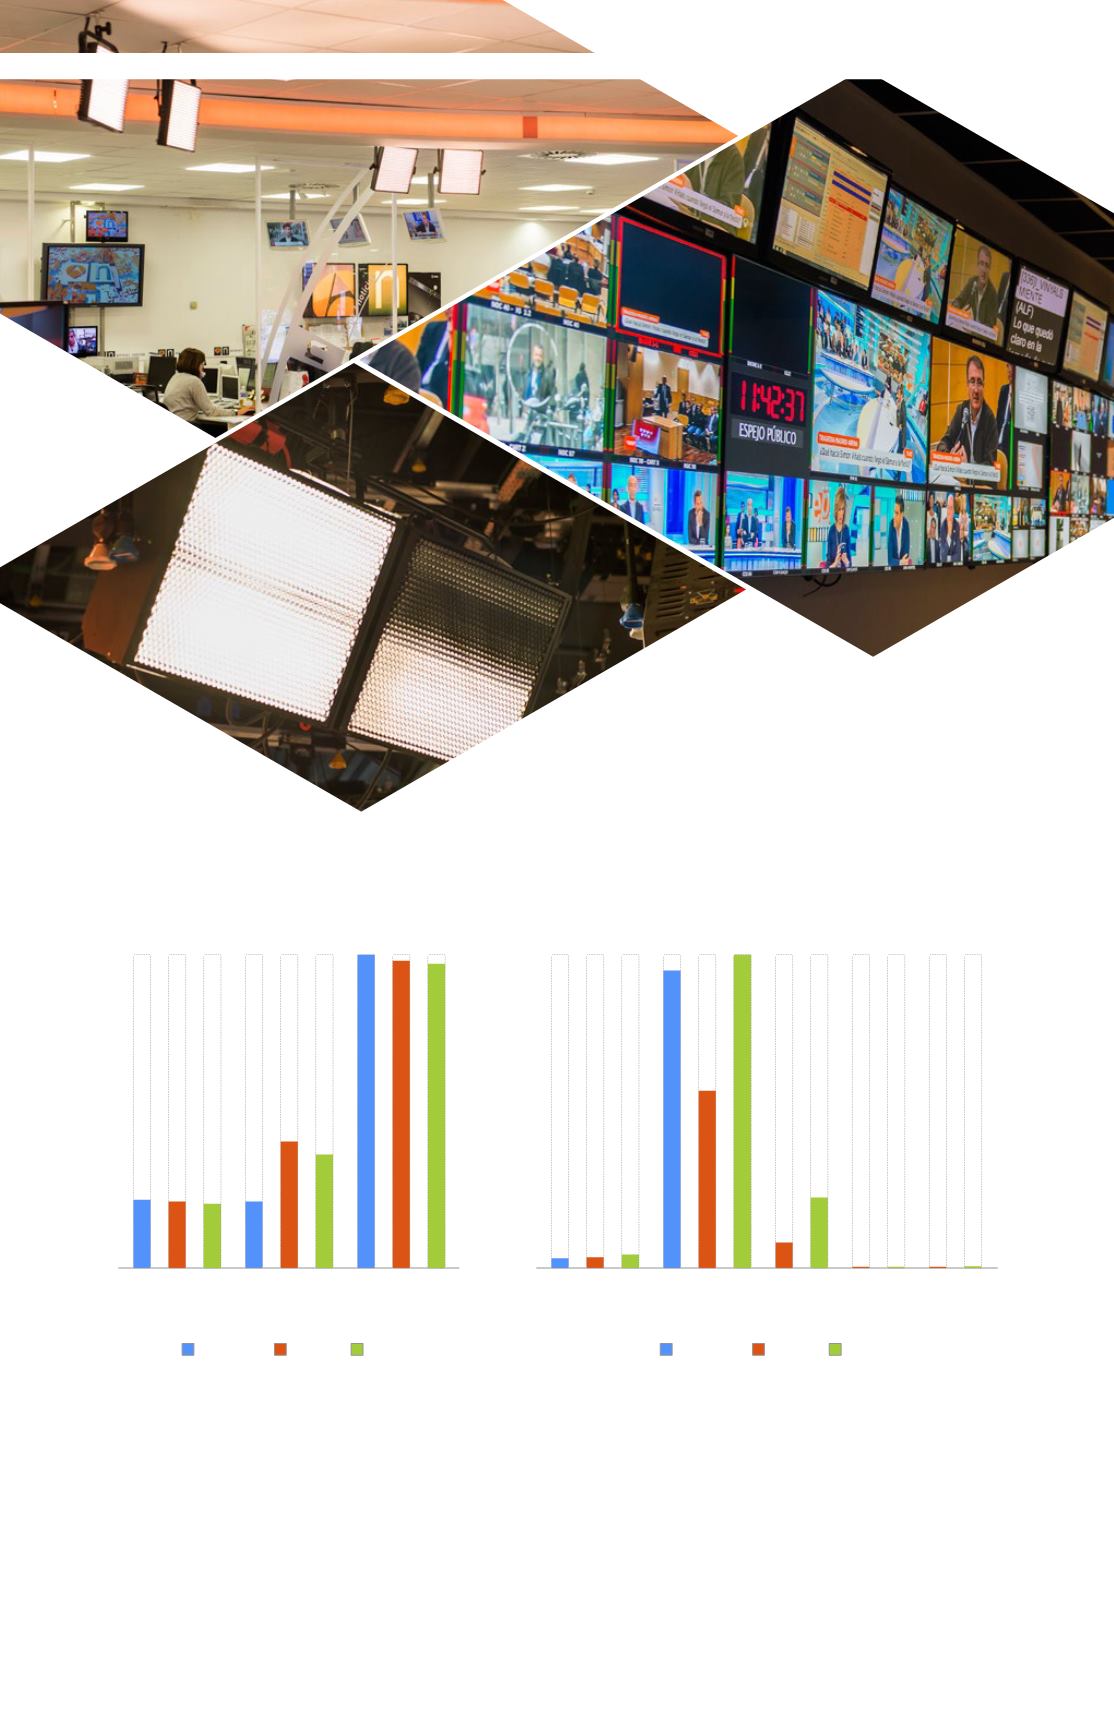
Non-hazardous waste
Paper and
cardboard
(t)
Debris
from works
(m3)
66
126
308
64
114
305
68
66
314
Solid
urban waste
(t)
2013
2014
2015
Note 15:
Data on non-hazardous waste production was taken
in the centre in San Sebastián de los Reyes.
Hazardous waste
Televisions
(units)
Fluorescent
lights (units)
62
976
390
78
1,725
0.53
0.54
0.52
0.66
57
1,635
144
Large
batteries
(units)
Toner
(t)
Small
batteries
(t)
2013
2014
2015
Note 16:
Data on hazardous waste production corresponds to the centre in San
Sebastián de los Reyes.
In terms of hazardous waste, this increased by 20% in televisions and 43% in florescent
lights. This increase comes as a result of the increase in television production, which brings
with it an increase in the surface area used (pre-assembly, connections with newsrooms,
etc.). All hazardous waste generated was recycled.
ATRESMEDIA
| ANNUAL AND CORPORATE RESPONSIBILITY REPORT 2015 |
THE ENVIRONMENT
|
201